
A chart generator turns a color grid into stitching instructions. The important output is not just a picture: it is a reliable mapping between coordinates, symbols and thread choices.
From cells to colors
The image is reduced to a chosen number of cells. Those cells are grouped into a limited palette, and each palette entry receives a symbol. Several original photo colors may map to the same output color. The printed legend must describe the final reduced palette rather than the source image, or the chart cannot be followed consistently.
Why symbols matter
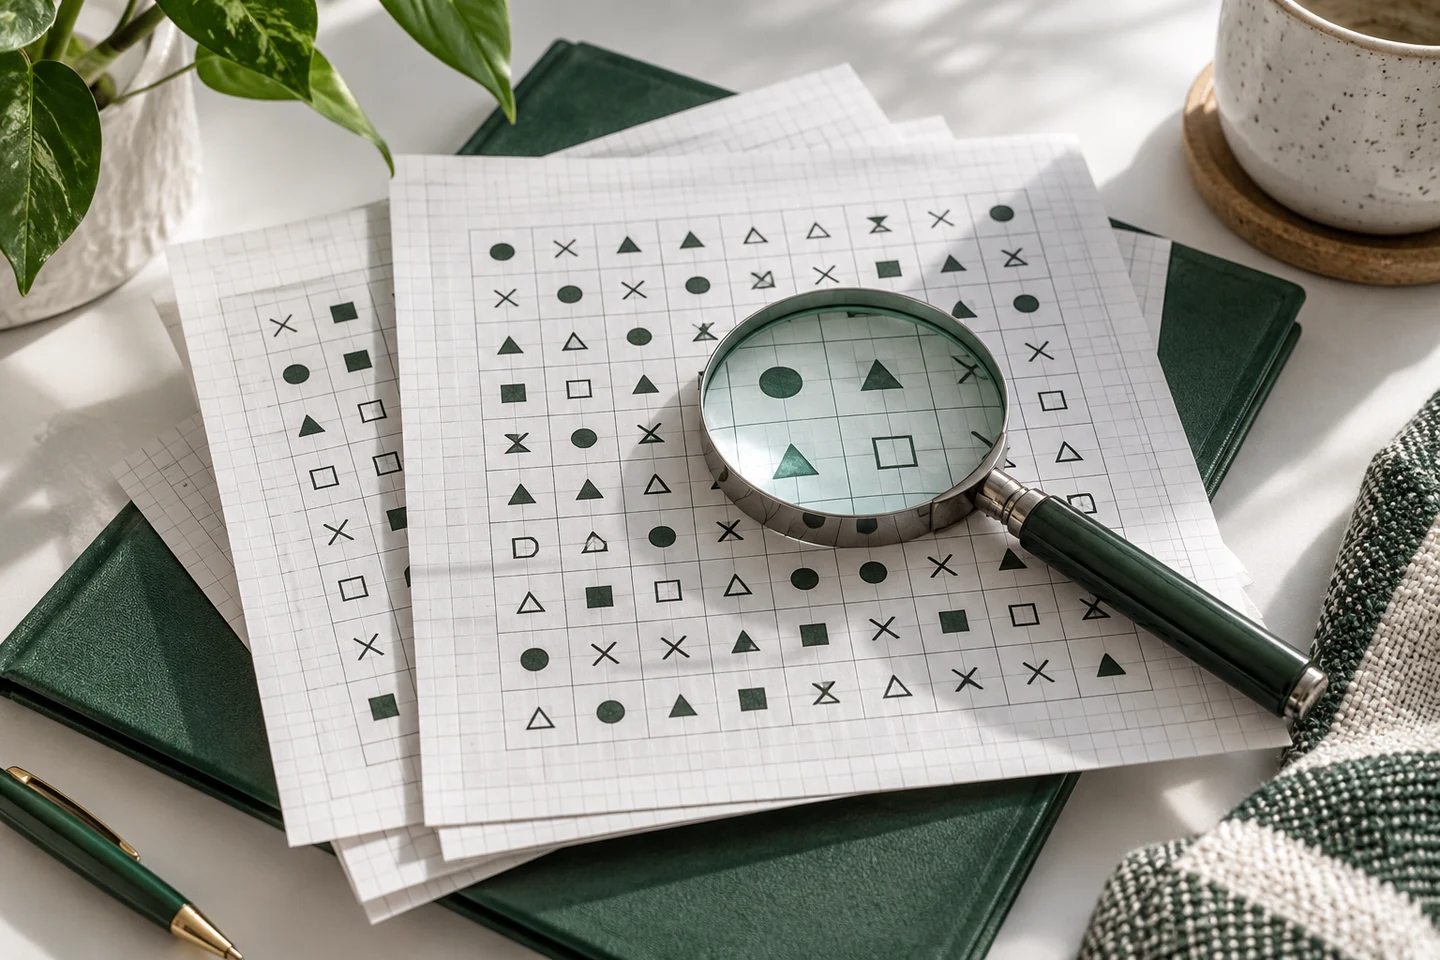
Printed colors change with ink, paper and screen settings. Symbols provide a second channel of information, making two similar-looking swatches distinguishable. A readable black-and-white chart is particularly useful when stitching in variable light. A symbol should be unique within the pattern and remain visible against its cell background.
How large grids become pages
Shrinking a 240-stitch chart onto one sheet creates tiny cells. Pagination instead divides it into readable sections. Our PDF sections cover up to 50 columns and 60 rows, with global coordinates and a page map for larger designs. Sections do not overlap. The map tells you where each sheet sits in the whole design.
Check the generated chart
Compare the exported dimensions, palette and cover with the preview you approved. Check a corner, the center and a page boundary. A symbol count should equal the number of cells assigned that color. Empty fabric cells should stay empty rather than receiving white thread accidentally. Our blank grid tool offers the same counting structure without a photo, useful for sketching an original motif. For a small ready-made example, inspect Nordic Star’s full-cross chart and legend.
Understand the chart as a small database of stitch instructions
A cross stitch chart can be described with three pieces of information: its dimensions, an ordered list of cells and a palette. Each cell points to one palette entry or indicates unstitched fabric. A renderer turns those records into colored squares, simulated crosses or printed symbols. This explains why the same design can have several visual styles without becoming several different patterns. The underlying assignments should remain unchanged when you switch display modes.
Consider a twenty-column grid. The first row contains twenty cell positions, then the next row starts at column one again. If a generator accidentally uses a different row width while printing, every later position shifts even though the palette remains correct. That is why checking dimensions and page coordinates is as important as looking at the cover image. Our blank grid tool makes this structure visible without a source photograph. You can mark a few cells and see how their positions depend on a stable row-and-column system.
Separate palette reduction from symbol assignment
Reducing an image to sixteen colors decides which digital shades share a palette entry. Assigning sixteen symbols is a later presentation step. These operations solve different problems. A good palette can still be printed with confusing symbols, and an excellent symbol set cannot repair a palette that has erased an essential feature. Judge the visual conversion first, then judge whether the chart communicates that conversion clearly.
The same symbol must identify the same palette entry everywhere in a particular file. A triangle should not mean green on one page and brown on another. If two palette entries are merged during editing, all affected cells and legend counts must be updated together. In our maker, the saved palette and cells are exported from the same record, avoiding a separate manually copied key. Read the photo color guide if the image itself needs improvement before export; read the chart quality guide if the main problem is legibility.
Choose symbols for recognition at normal working distance
The best symbol is not necessarily the most decorative one. Simple, distinct characters usually survive small-cell printing more reliably than elaborate icons with fine internal lines. Confusable pairs deserve attention: a narrow vertical mark and the numeral one may become difficult to distinguish after printing. Filled and outlined versions of the same tiny shape can also merge when ink spreads. A symbol collection should be judged in actual chart cells, not only in an enlarged legend.
Contrast matters on color charts. A black symbol on a very dark fill may be technically present but functionally invisible. A renderer can choose a light symbol for dark cells and a dark symbol for pale cells. The monochrome option removes that dependency by using dark symbols on a light background. Test the format under your normal task lighting. If you annotate completed stitches, check that your chosen pen does not turn two originally distinct symbols into indistinguishable dark marks. The black-and-white chart comparison helps you choose a comfortable working copy.
Read bold grid lines as counting aids, not extra stitches
The dark rules at ten-cell intervals divide the chart into convenient blocks. They do not occupy a column of fabric and do not represent backstitch. When you count across a bold line, continue directly into the next ordinary cell. A frequent beginner error is to treat the rule as a gap or count a line twice. Counting the cells themselves prevents that shift.
Boundary numbers can label the edges of blocks rather than the center of individual squares. A label zero at the outer border means that no cells have yet been crossed; the first cell lies immediately beside it. A label ten marks the boundary after ten cells. Follow the chart’s printed explanation and coordinate ranges rather than assuming every publisher labels grids identically. Our chart sections state their global column and row ranges above the grid. Practice with Nordic Star, where the repeated geometry makes a one-cell counting discrepancy easy to notice before it spreads.
Understand why a large chart needs a page map
A large design divided into sections is easier to print and mark than one compressed into a single small sheet. The page map shows the position of each section in the complete rectangle. It should tell you whether the sequence runs across rows, down columns or in another explicit order. File page numbers alone are not enough because the cover and legend also occupy pages before the chart begins.
Our sections cover up to fifty columns and sixty rows. A 120 × 120 design therefore uses three section columns and two section rows, giving six chart sections. The final section column is narrower because only twenty design columns remain. Those shorter edge sections are intentional, not missing content. A map makes this obvious. Use the global coordinates when joining pages rather than trimming paper until images seem to match. The printing guide explains a practical workflow for keeping the map, legend and current section within reach.
Check counts independently when a chart seems inconsistent
The sum of per-color stitch counts should equal the number of filled cells. For a full-coverage 100 × 80 image, that total is 8,000. For an open motif on the same grid, it may be much lower because blank fabric occupies some cells. A generator should not count those empty cells as white thread unless the design explicitly assigns white stitches to them. The distinction affects both appearance and the floss shopping list.
A simple hand check can reveal a problem in a small chart. Count one isolated color area row by row, add the totals and compare the legend. You do not need to recount a huge photograph manually, but checking a small, distinctive region is a useful sanity test. If a file has conflicting counts or a missing key, return to its source before stitching. The floss estimator assumes your input count is meaningful; no material formula can compensate for incorrect underlying chart data.
Keep display effects separate from construction instructions
A realistic stitch preview may show fabric texture, tiny shadows and highlights on thread. These details help you imagine the finished surface, but they are not extra stitches or special materials. The chart still consists of its recorded crosses. Similarly, an editorial image showing a beautiful embroidery scene is not a downloadable pattern unless a corresponding stitch chart exists. This website labels AI-generated editorial imagery and uses deterministic chart data for its actual pattern previews.
Check any compatibility claim against the file you will use. A PDF readable by a person is not automatically importable by every tracking application, and a visually attractive cover says nothing about machine-readable structure. We do not claim tested Pattern Keeper support. If you work from paper, choose the clearest print; if you use another application, check its current import requirements independently. The pattern maker guide describes the export choices that are actually provided rather than assuming another tool’s features are available here.
A practical chart-generator inspection routine
Before printing the whole file, inspect its dimensions, palette, symbols, guide lines and one page boundary. Then print one dense section at the intended size. Compare it with the preview and verify that the text is not clipped. This short inspection is particularly valuable for a converted photo, where hundreds of similar-looking cells can hide a legend or pagination error.
Can a chart use numbers as symbols? Yes, provided each number remains distinct and the legend is unambiguous. Does a colorful grid always need symbols? A tiny hand-drawn design might be understandable without them, but a reliable printable chart should not depend on color alone. Can you enlarge the print without changing the pattern? Yes: the fabric count determines stitch size. Keep the coordinates and section boundaries intact, and avoid treating a larger paper square as an instruction to span more fabric blocks. The chart is a map, not a scale drawing of the cloth.
Blank cross stitch grid maker · Download the original nordic star pattern
Examples, diagrams and planning estimates are original Cross Stitch Creator content.